Net Promoter Score: what is it, and how can you use it?
The Net Promoter Score (NPS) is a customer satisfaction metric aiming to measure the loyalty that exists between an organisation providing services (or goods) and a consumer or user.
This score is an industry standard in marketing and is the single most used score to evaluate users satisfaction and predict customer loyalty. It provides a single score between -100 and +100 that can be easily interpreted as a one-off metric, monitored over time, or compared with the score obtained by other services within the same organisation or other organisations.
If you’re running a non-profit and are considering ways of monitoring user feedback, the NPS is a great place to start, since it’s both easy to collect and straightforward to interpret.
Definition
The score is based on the responses to a single question asked to a sample of users, usually taken either immediately after the service was provided, or a short time afterwards (e.g. a few days). Some organisations measure both scores as they might provide insights on different aspects.
The users can answer the question on a scale from 0 to 10 (usually).
The question is usually formulated as: ‘How likely is it that you would recommend our company/product/service to a friend or colleague?’
Users are then bucketed into groups based on their score:
Users with a score of 9 or 10 are called Promoters and are thought of as very satisfied users, likely to refer the service to their friends or family, or return.
Users with a score of 0 to 6 are called Detractors and are considered as less likely to recommend the service or return.
Users with a score of 7 or 8 are called Passives and are considered to display a behaviour between Promoters and Detractors.
How to compute it
The Net Promoter Score is then computed as the percentage of customers who are Promoters minus the percentage of customers who are Detractors. Although the Passives do not explicitly appear in the calculation, they count in the total number of respondents, thus reducing the proportion of Promoters and Detractors and pushing the NPS towards zero.
To get an intuitive understanding, it can help to think of the extreme cases. If everyone gives a score between 0 and 6, then 100% of the respondents would be Detractors, so the score would be -100. On the other hand, having all users scoring a 10 would mean that 100% of the respondents are Promoters, which makes the NPS +100. Finally, if all responders are Passives, then the NPS will be zero.
The NPS varies across industries, but it is generally acknowledged that a positive score is good, a score of +50 or more is excellent and a score of +75 or more is exceptional (see [2, 3] for more details).
It is good practice to then follow up with an open-ended question where the users can explain the reason for their ratings, as it is a good way to address issues or improve the service.
Example
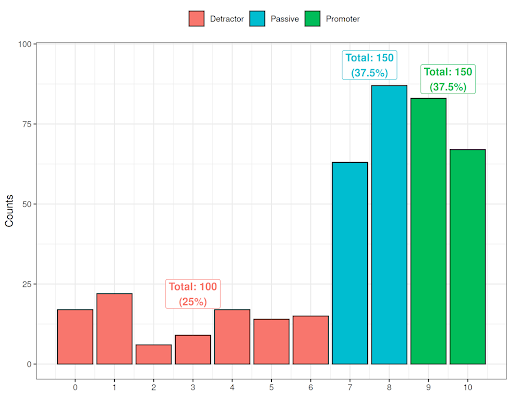
A NPS survey on 400 users of a service returned the following answers:
To get the NPS score we follow these steps:
The total count of the Detractors (0-6 answers) is 100 users, corresponding to 100/400 = 25% of the total.
We have 150 Passive users (scores 7-8), corresponding to 37.5% of the respondents.
Similarly, we have 150 Promoters (scores 9-10), also corresponding to 37.5%.
The NPS is then computed as % Promoters - % Detractors = 37.5% - 25% = +12.5%.
Since it is positive, we conclude that users are overall satisfied with the service (although the service can be improved, as the best NPS that can be reached is +100%).
Comparing scores
One of the advantages of the NPS is its flexibility, as it allows to compare scores:
Scores can be tracked over time, enabling the measurement of the changes in customer perception on a service, which is particularly useful if the service also evolved over time
Scores can be compared across services, e.g. to help an organisation to easily identify the most popular services and the ones that need to be improved
Scores can also be compared between similar services (within reason) in the same field –although the specifics of the service and the way of executing the NPS survey may affect the score and make it harder to compare.
Pros & cons
Advantages
Short and consistent methodology, easy to evaluate
Users can answer with minimal effort, ensuring high completion rate
Fair comparisons over time and with different services / organisations
Good prediction of future loyalty
Limitations
The same information can be obtained using other formulations of loyalty questions
The 0-10 scale is somewhat arbitrary
Multiple indicators (e.g. a larger number of questions) can provide a better prediction of loyalty
Resources
What Is a Good Net Promoter Score? Some numbers on average NPS by industry, and some tips on how to improve it.
Why The Nonprofit Sector Should Be Excited About Net Promoter Scores A short blog post recommending nonprofits to start using NPS as an effective way to collect feedback that can be monitored over time.
Net Promoter Score for the Nonprofit Sector: What We’ve Learned So Far – Feedback Labs Feedback Labs discusses of NPS in the context of nonprofits with some tips on why and how to do it right. Some key tips are to keep surveys simple but frequent and to acknowledge that followup analysis is needed.
Reasons nonprofits should avoid the Net Promoter Scores A post on drawbacks and considerations about how useful NPS is.

